

Capability: Dashboards and Reports
Say what you want to see. Get the chart.
Describe a view in a sentence and Canvas builds it from your connected data. Save it, schedule it, and it reaches people where they already read their messages.
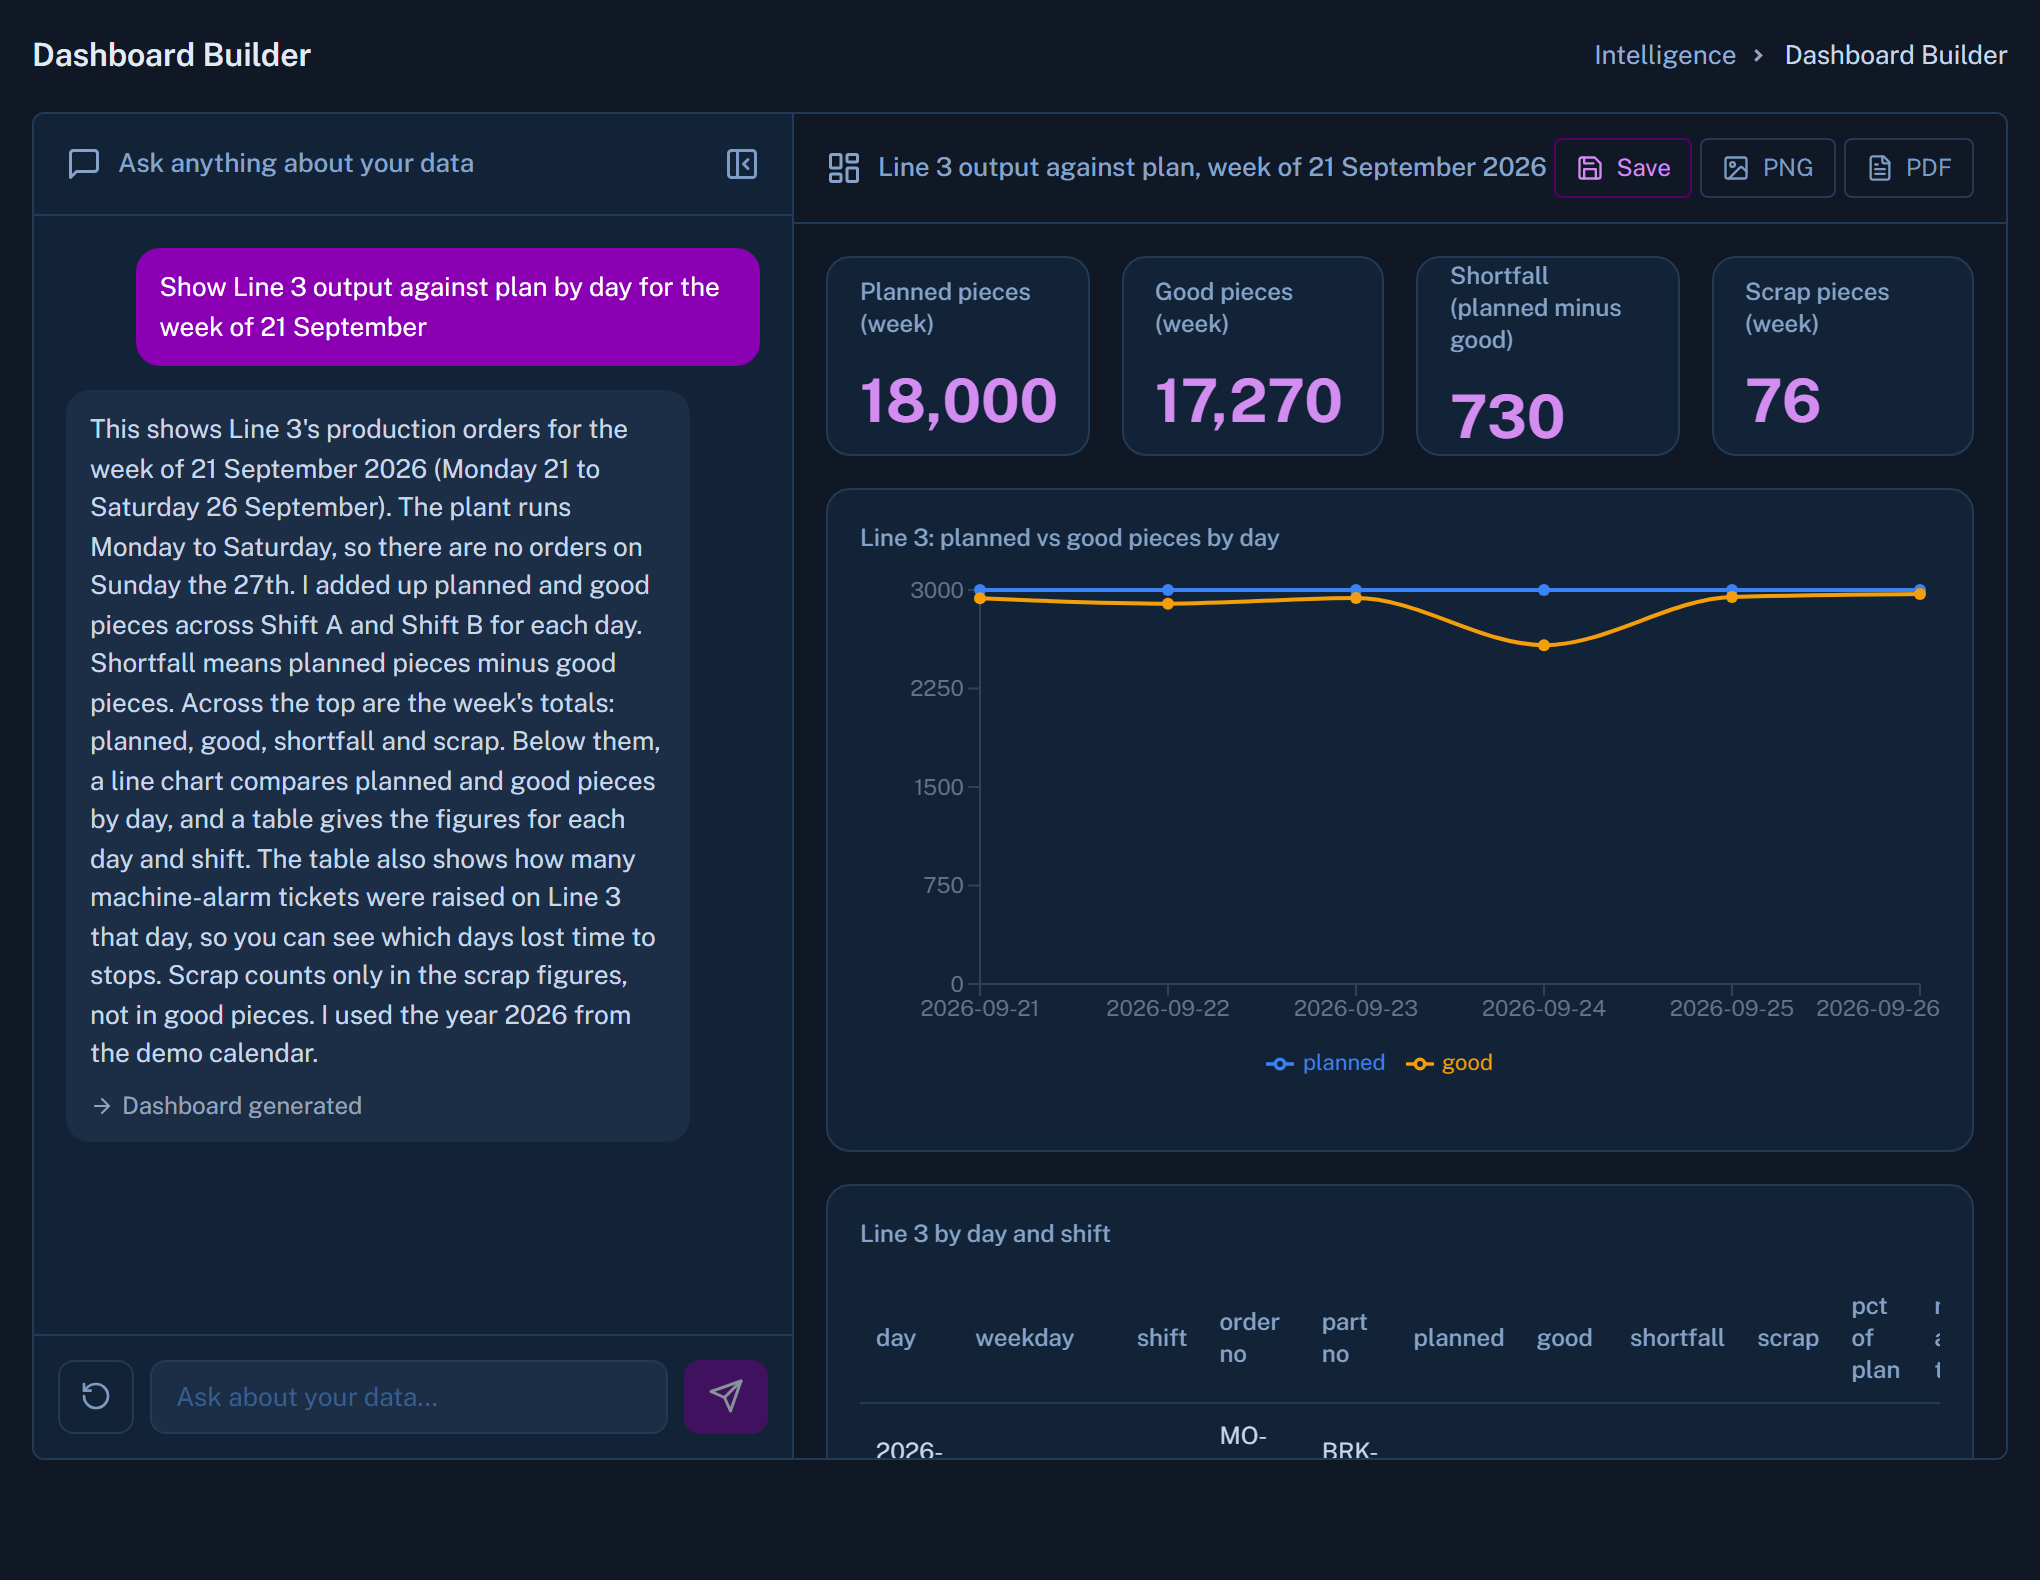
Straight answers inside a domain
Not a blank search box. A trusted answer.
Canvas answers questions within a domain it understands, such as vehicles on site or open tickets by building. That is what keeps the answer reliable enough to act on.
- Questions answered from your approved data model
- The rows behind every chart are one click away
- Built by your team or your integrator partner
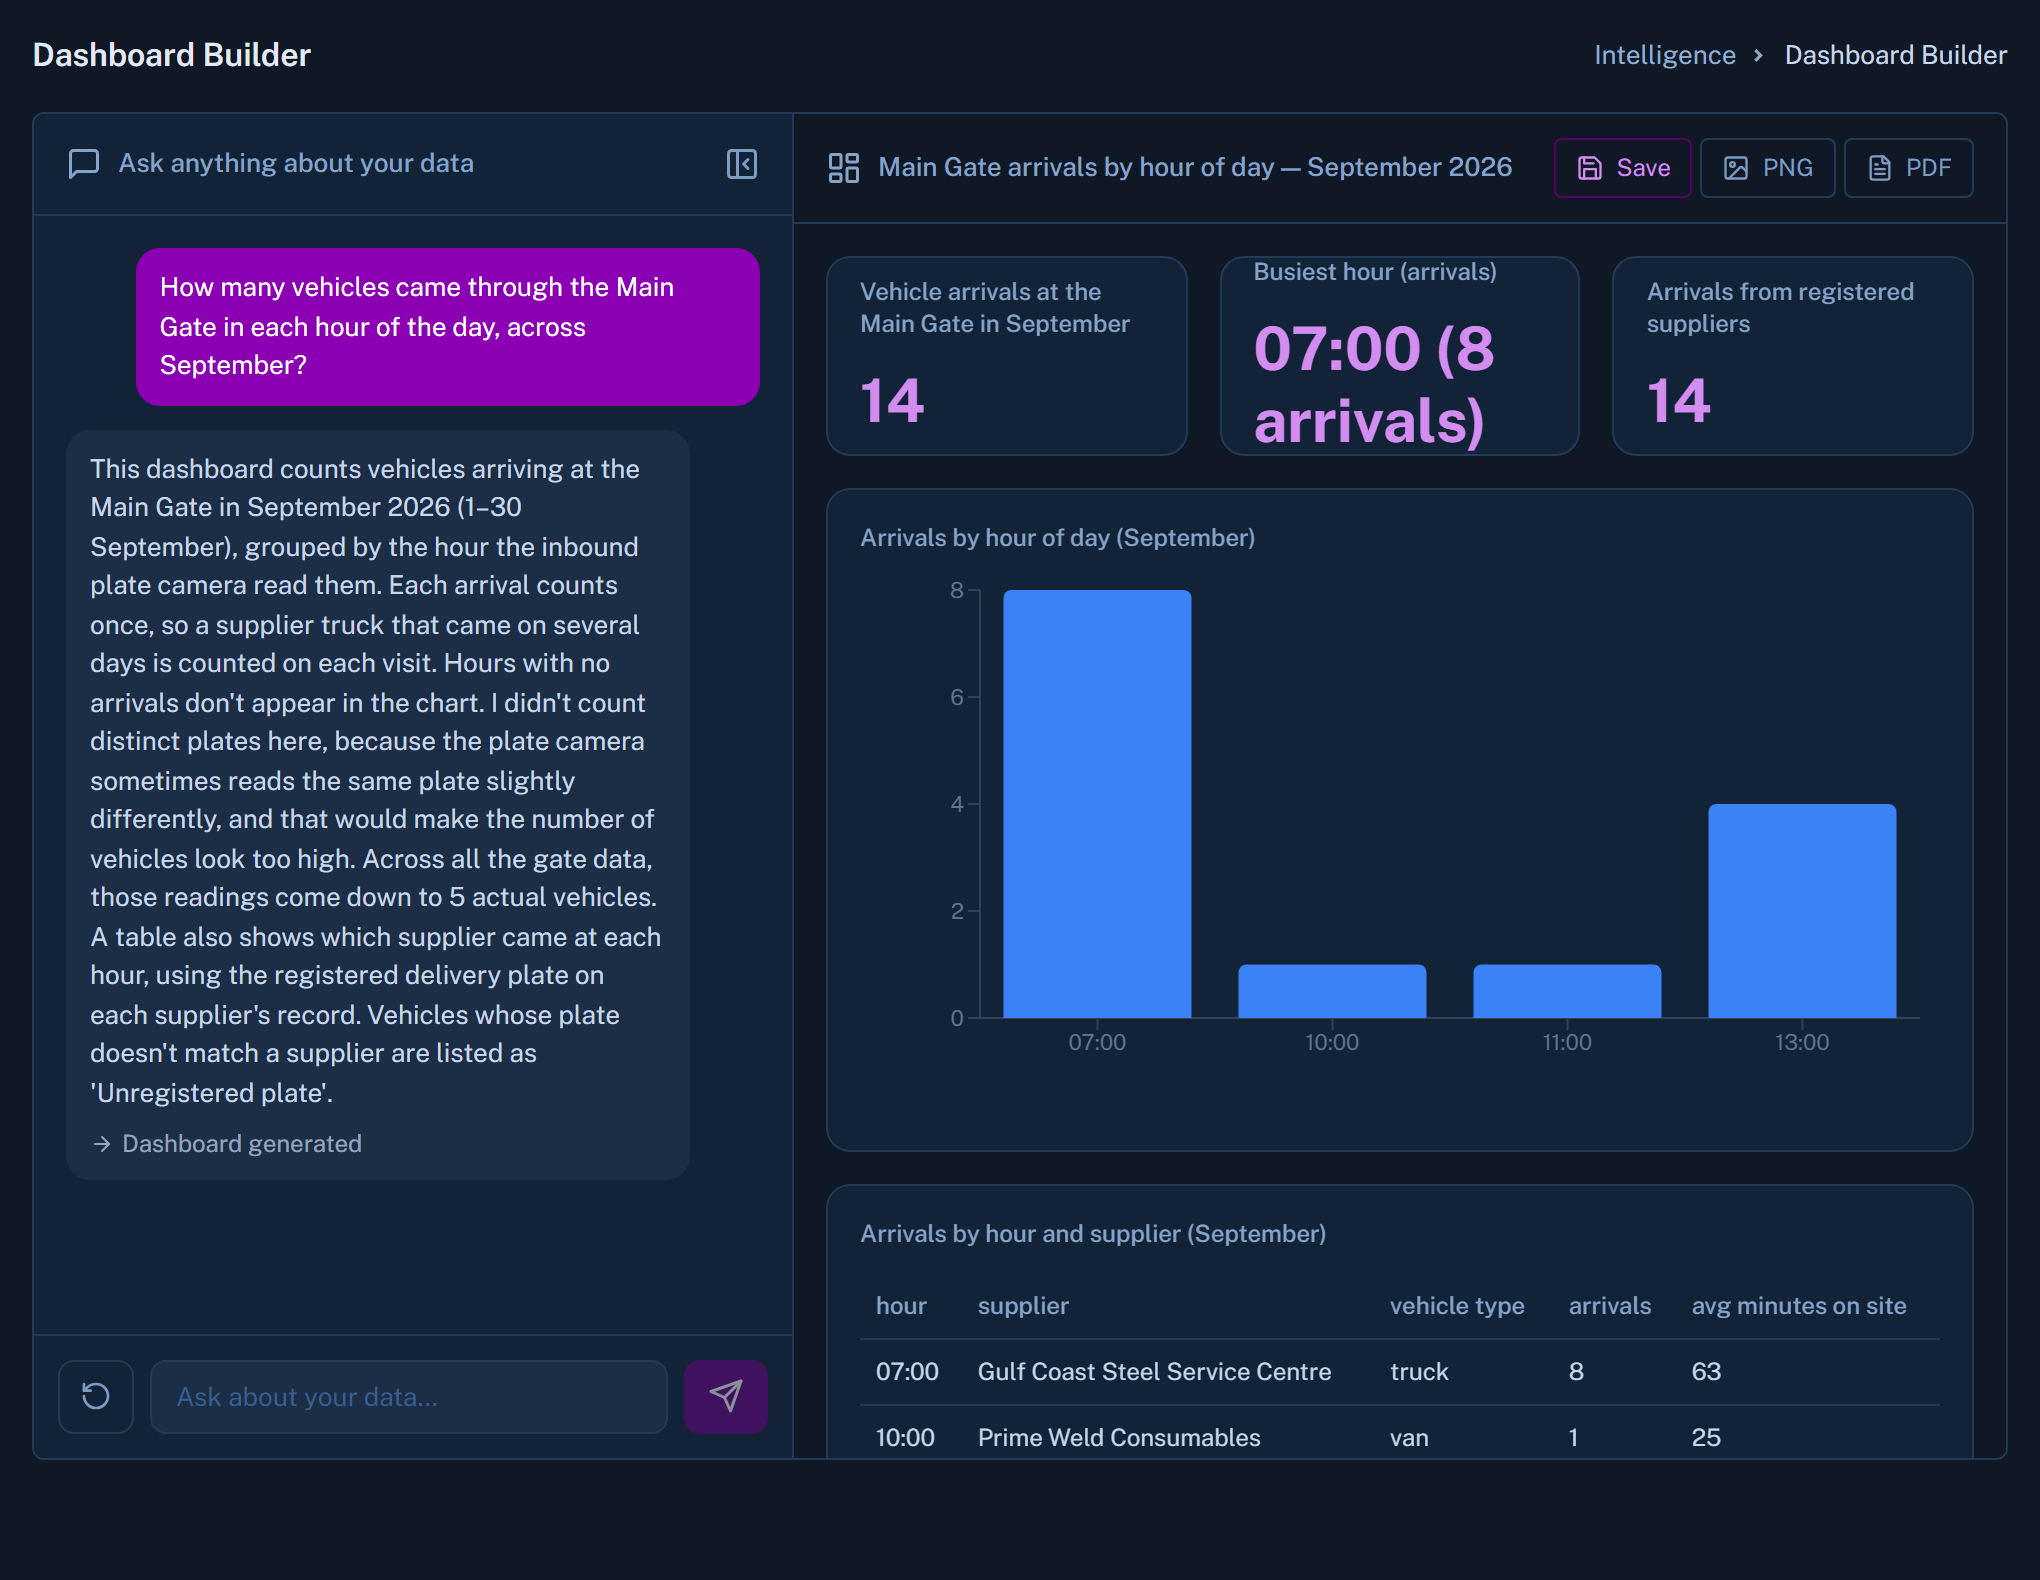
From question to routine
A chart becomes a report people actually receive
Ask
Type the view you need in plain words.
Save
Keep it as a dashboard in Reports.
Schedule
Choose when it goes out and to whom.
Deliver
It arrives by LINE, Telegram or email. Export it when a file is needed.
Where each tool sits
| Its job | With Canvas | |
|---|---|---|
| Your ERP | The system of record | Stays as it is |
| Canvas | The system of operations | Live answers and reports on what is happening |
| Power BI | Deep analysis | Canvas sends data out to it. One direction only |
Good to know
Who builds the dashboards?
On the Starter tier, customers view, schedule and export reports. The dashboard builder is used by the Vailient team or your integrator partner.
Does Power BI feed data back into Canvas?
No. The connection is outbound only.
Put the Monday report where Monday starts.
We will build one of your regular reports on demo data and schedule it to a chat channel.