

Use case
What the building generates and uses, next to everything else.
Solar and utility feeds come into Canvas through the connectors you already have, so energy sits beside alarms, tickets and equipment rather than in a separate tool.
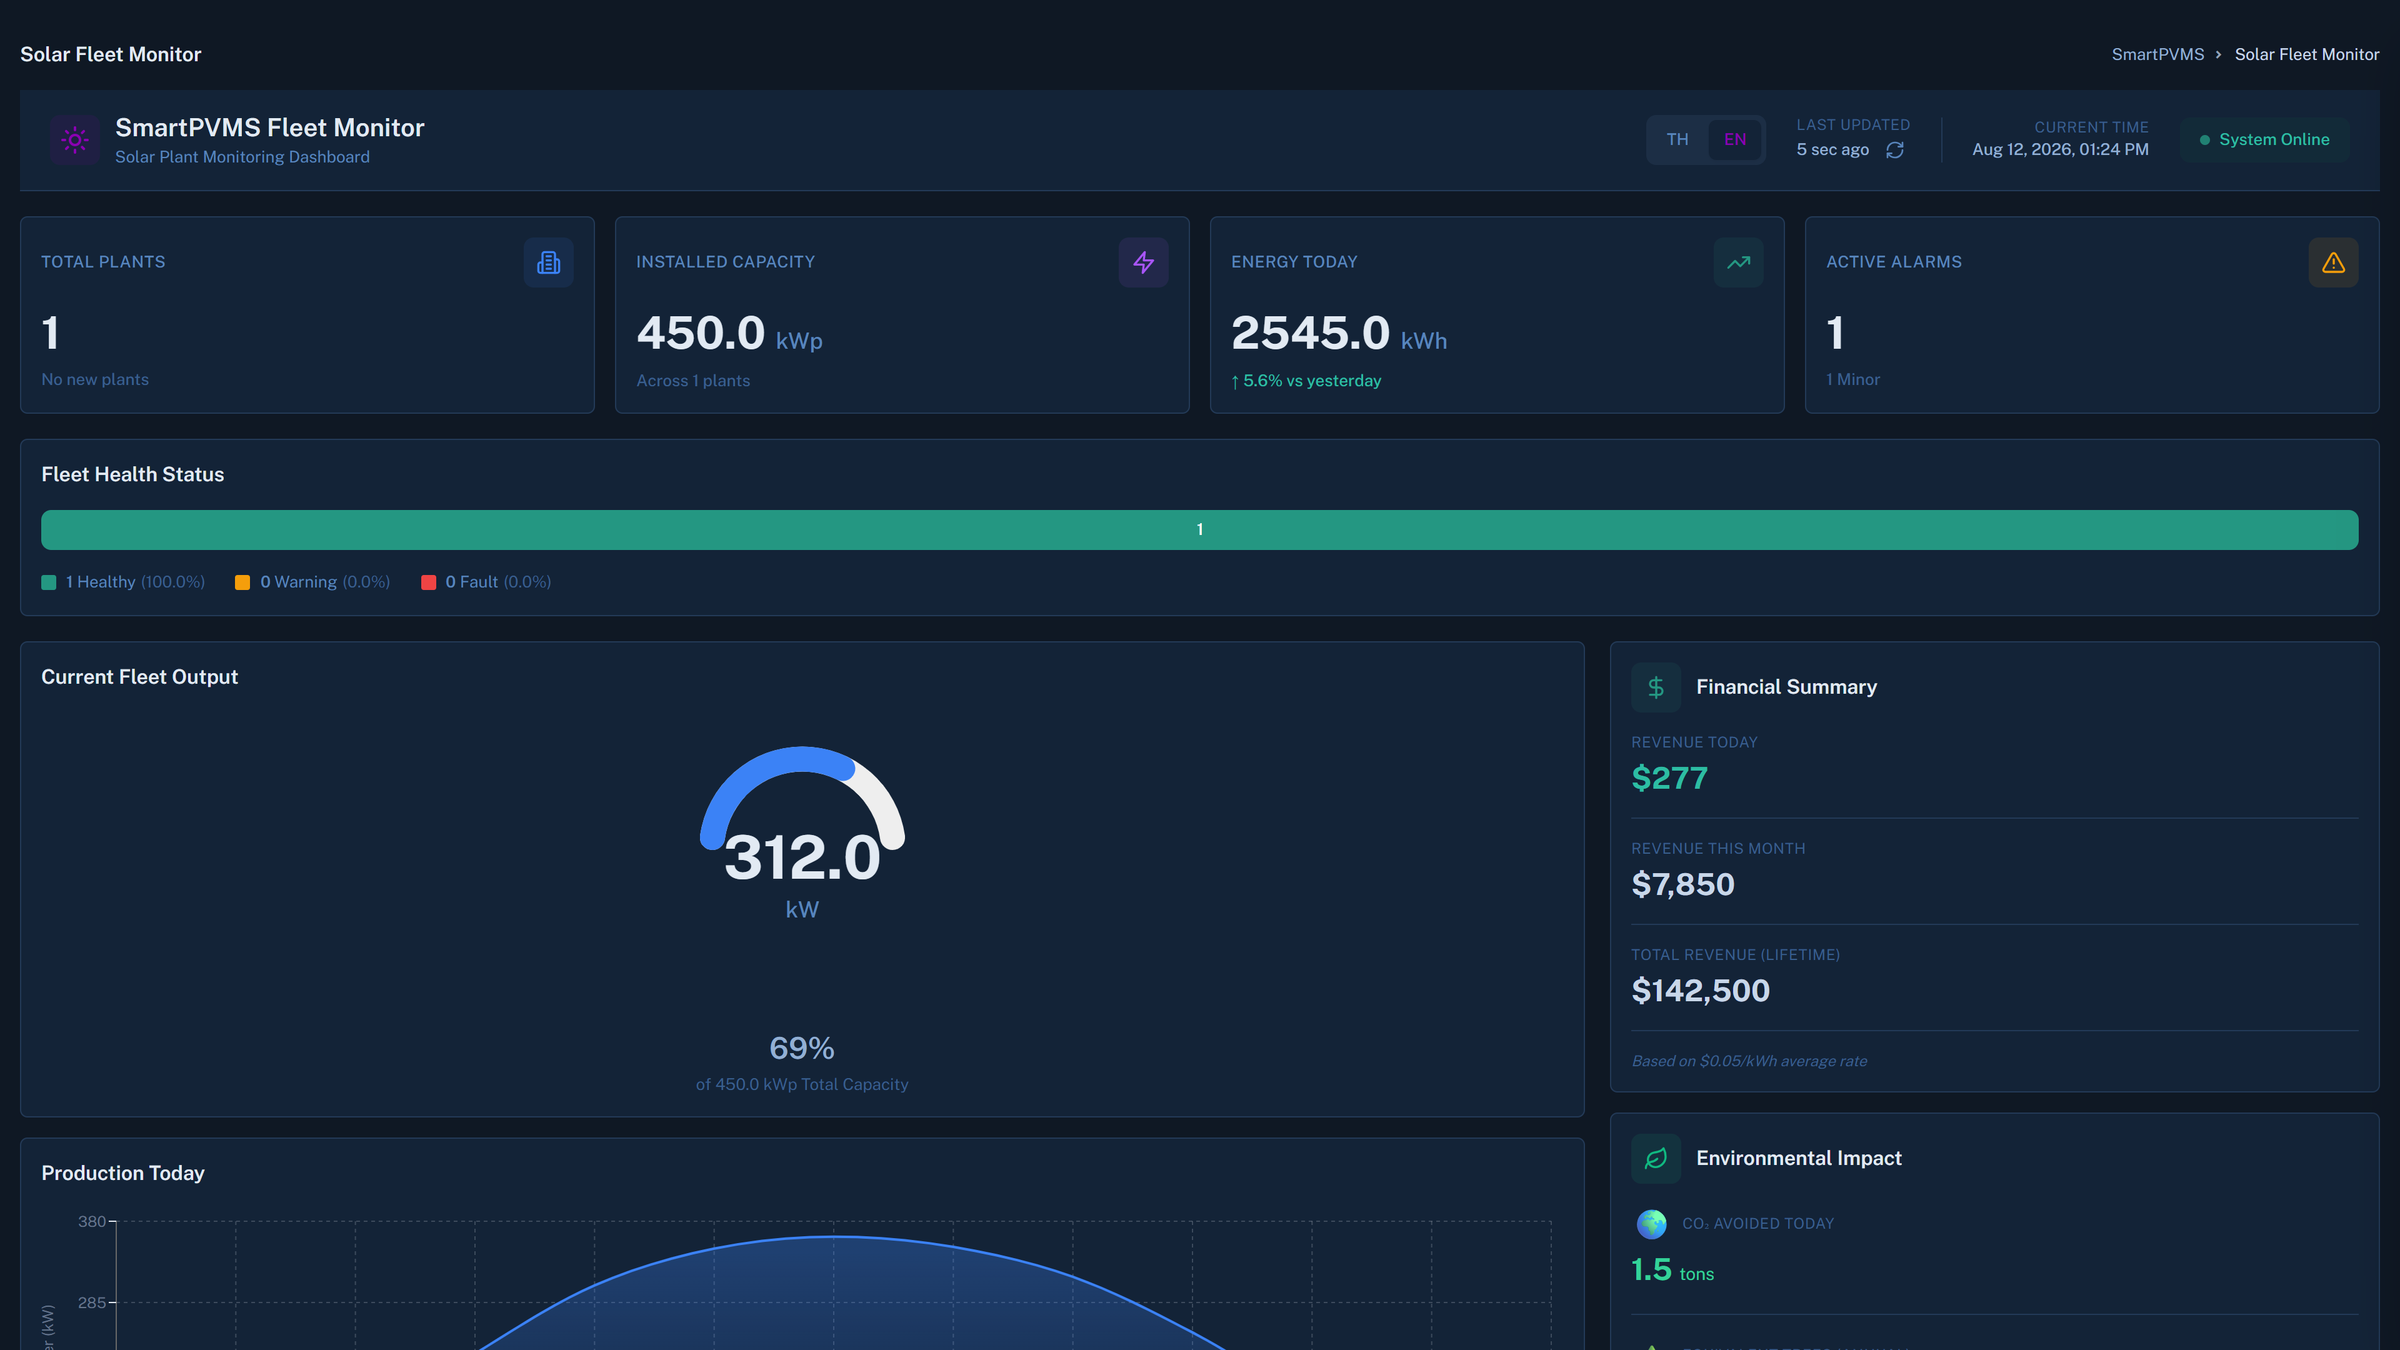
How data arrives
Connectors that exist today
MQTT and REST
For inverters, meters and gateways that publish data.
Advantech ADAM I/O modules
For metering and signals wired into I/O.
SQL databases and network folders
For Excel and CSV exports from utilities and installers.
BACnet
For building plant that reports its own load.
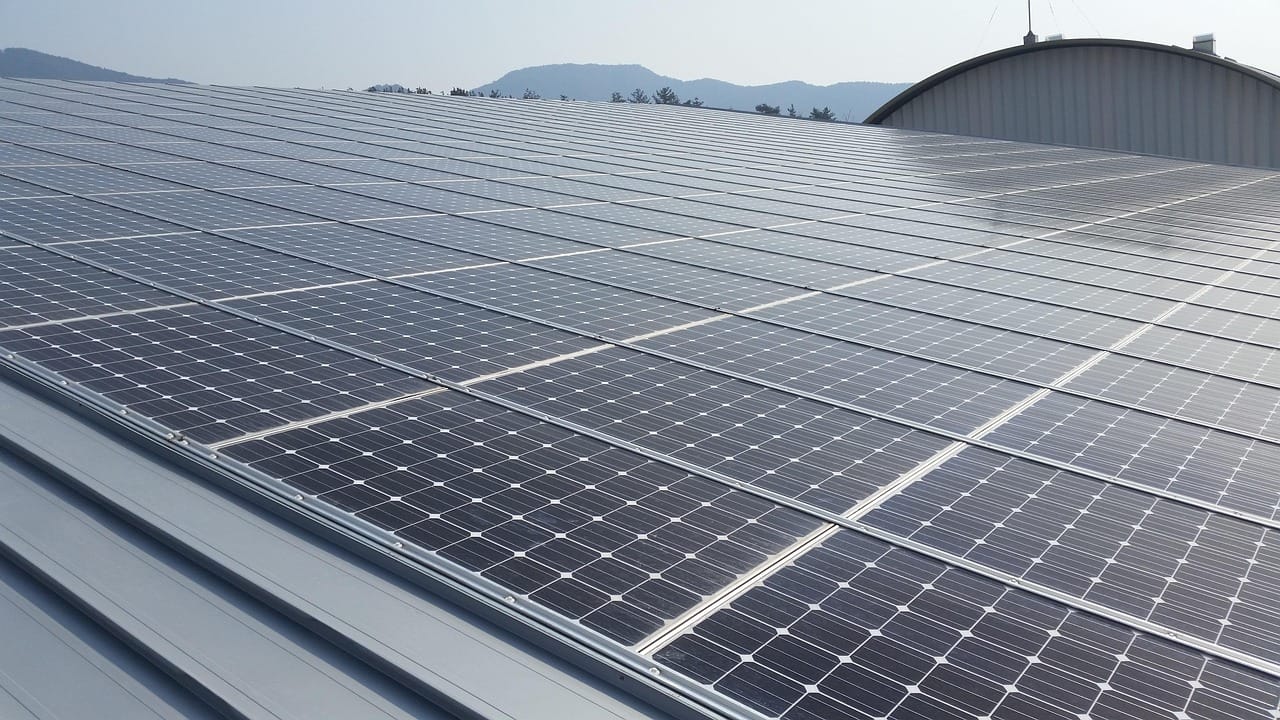
Reporting follows the running of the building
Teams that watch energy closely end up with clean data for sustainability reporting. Canvas lets you schedule reports to LINE, Telegram or email, but the point is operating the building well. The report is a consequence.